TN
ToolsNetwork
GRID

GRID

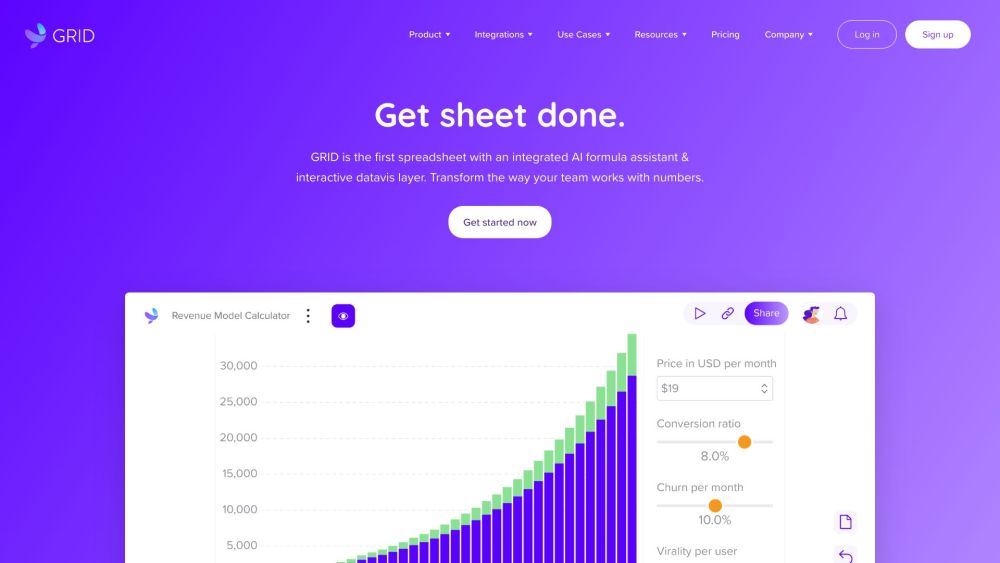
GRID is an intelligent data management tool that synchronizes and displays information from multiple sources.

Monthly Visitors107.4K


Social media links

What is GRID?

GRID is an intelligent data display surface that connects to and displays information from spreadsheets and databases. It offers a well-known spreadsheet layout with strong connections for Notion and Airtable.

How to use GRID?

To begin using GRID, create or link a spreadsheet or data source first. Next, choose the data you want to visualize and make it interactive by using the built-in spreadsheet editor. GRID lets you merge data from various sources into a single chart and share your work by embedding it in websites or internal wikis.

Features

  • Connects and displays information from spreadsheets and databases

Use Cases

  • Creating robust business calculation tools
  • Designing flexible financial frameworks
  • Creating dynamic reports and dashboards for marketing teams and sales departments.
  • Examining the success of a campaign and monitoring key performance indicators.
  • Developing engaging financial reports that encourage user interaction
  • Predicting and estimating income.
  • Displaying data in an attractive way

Frequently Asked Questions

GRID is an intelligent data display surface that connects and displays data from spreadsheets and databases. It offers a recognizable spreadsheet interface with strong connections for Notion and Airtable.

To utilize GRID, begin by creating or linking a spreadsheet or data source. Next, choose the data you wish to visualize and incorporate interactivity using the integrated spreadsheet editor. GRID enables you to merge data from multiple sources into a single chart and integrate your work into websites or internal wikis.

GRID is an intelligent data tool that connects and displays information from spreadsheets and databases. Users can examine data through interactive analysis, create visually appealing reports, work together smoothly, and make quick choices based on data.

To use GRID, begin by creating or linking a spreadsheet or data source. Next, choose the data you want to visualize and add interactive features using the built-in spreadsheet editor. GRID enables you to merge data from various sources into a single chart and integrate your work into websites or internal wikis.

GRID's main functions involve connecting to and displaying data from spreadsheets and databases, having a built-in spreadsheet editor with well-known formulas, strong connections for Notion and Airtable, interactive forecasts and visual displays, the ability to merge data from various sources into one chart, and the option to insert work into websites and internal knowledge bases. It also has AI helpers for quick formula ideas and smart chart assistance.

GRID has several key applications, including developing advanced business calculators, designing flexible financial models, and creating interactive marketing and sales reports and dashboards. It also helps analyze campaign performance and track KPIs. Additionally, GRID enables the creation of interactive financial reports. Furthermore, it aids in forecasting and projecting revenue.
Alternative Tools