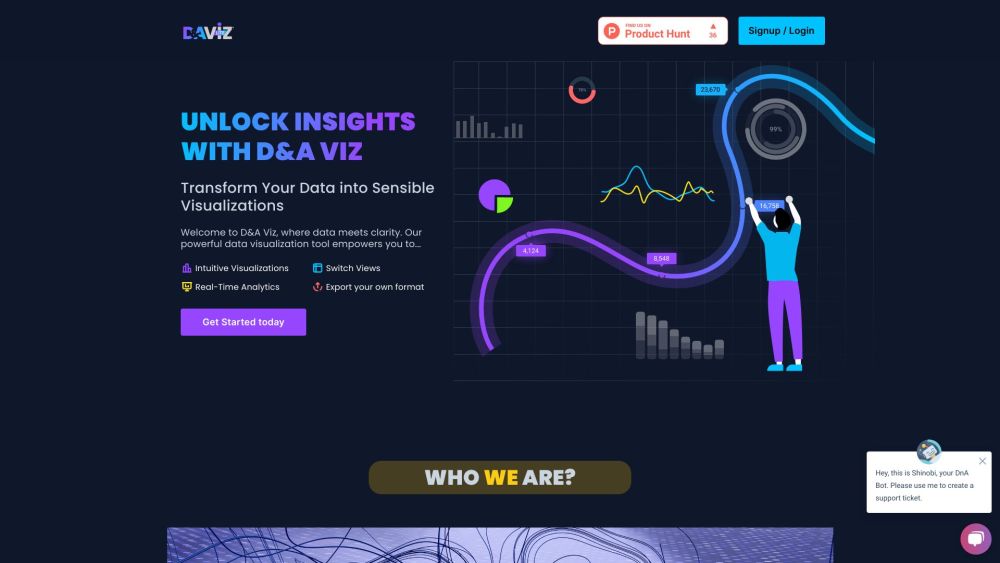
D&AVIZ
Converting unprocessed information into engaging graphics.
What is D&AVIZ?
An Artificial Intelligence marvel turning raw data into stunning visuals
How to use D&AVIZ?
Effortlessly transfer Excel or CSV files, ask the tool questions, and watch pie, donut, or linear graphs appear, turning complicated data into useful information for smart choices.
Features
- Easy-to-understand Visualizations
Frequently Asked Questions
A technological wonder, AI, converts raw data into stunning visuals.
Effortlessly import Excel or CSV files, ask the tool a question, and instantly see pie, donut, or linear charts appear, transforming complicated data into useful information for making smart choices.
Importing data from different sources, like Excel or CSV files, is a straightforward process.
D&AVIZ lets you customize the visualizations to fit your specific requirements.
D&AVIZ offers interactive and user-friendly dashboards that enable seamless sharing of your valuable insights with others.
Making data visual helps to break down complicated information, allows for instant tracking, makes it easier to make smart choices, and creates interesting presentations.
To get in touch with us, simply complete the contact form available on our website.
Alternative Tools
K8Studio
Effortlessly oversee and control your Kubernetes clusters.
Code&IT
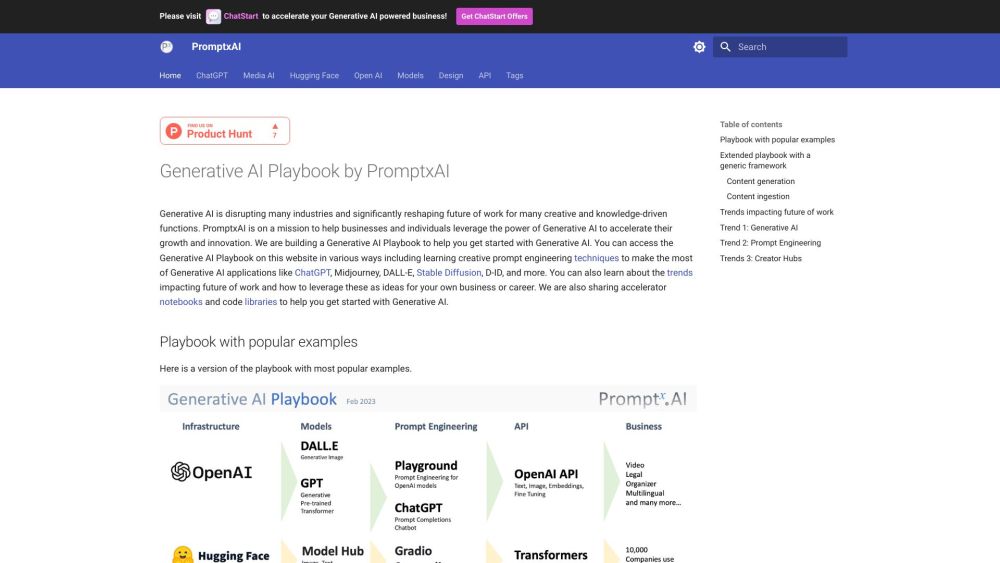
Generative AI Playbook by PromptxAI
Leveraging Generative AI for Expansion and Innovation: The Generative AI Playbook by PromptxAI offers illustrations and strategies.
Prompt
Other

Voxxio
Turn your spoken ideas into storyboards created by Voxxio's AI technology.
Uncategorized