Chartify
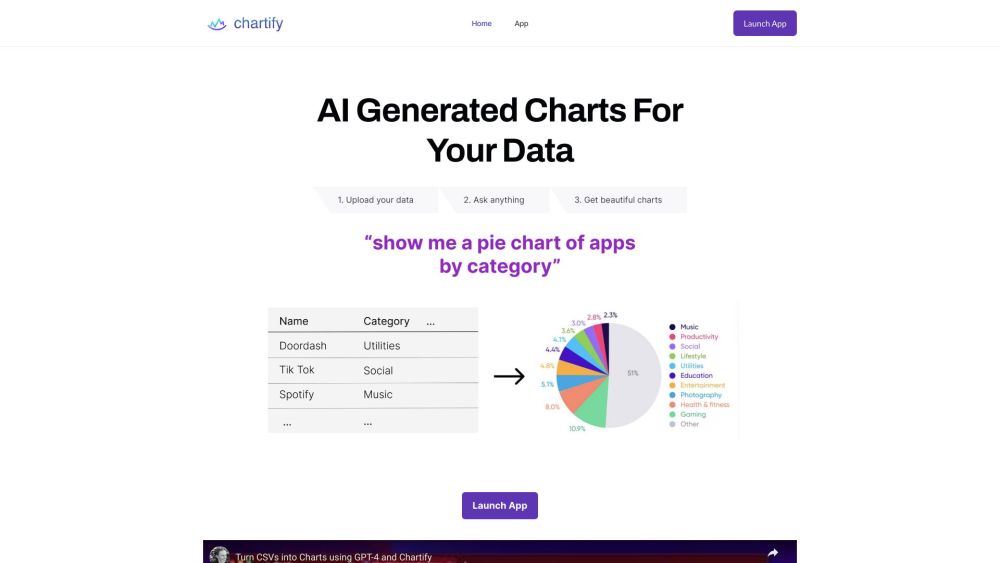
Chartify is a tool powered by Artificial Intelligence that transforms data into interactive charts and suggests suitable chart types.
What is Chartify?
Chartify is a tool that uses Artificial Intelligence to create charts, letting users change CSVs and database tables into detailed, interactive charts and graphs. It provides a new method to show data, giving users AI-suggested visualizations and letting them ask for specific types of charts.
How to use Chartify?
To use Chartify, follow these steps: 1. Import your data into Chartify by uploading a CSV file or linking to a Postgres or MySQL database. 2. Receive suggested visualizations, which the AI will create based on the information in your data. 3. Request specific charts by defining the type of chart you want, such as a stacked bar chart showing revenue growth by product line over the past 20 years.
Features
- Artificial Intelligence-created data illustrations
Use Cases
- Examining Information
- Data Visualization
- Reporting
- Presentations
- Commercial data analysis
Frequently Asked Questions
AI Photo Robot
The entire web-based AI photo creation tool utilizing LoRA.
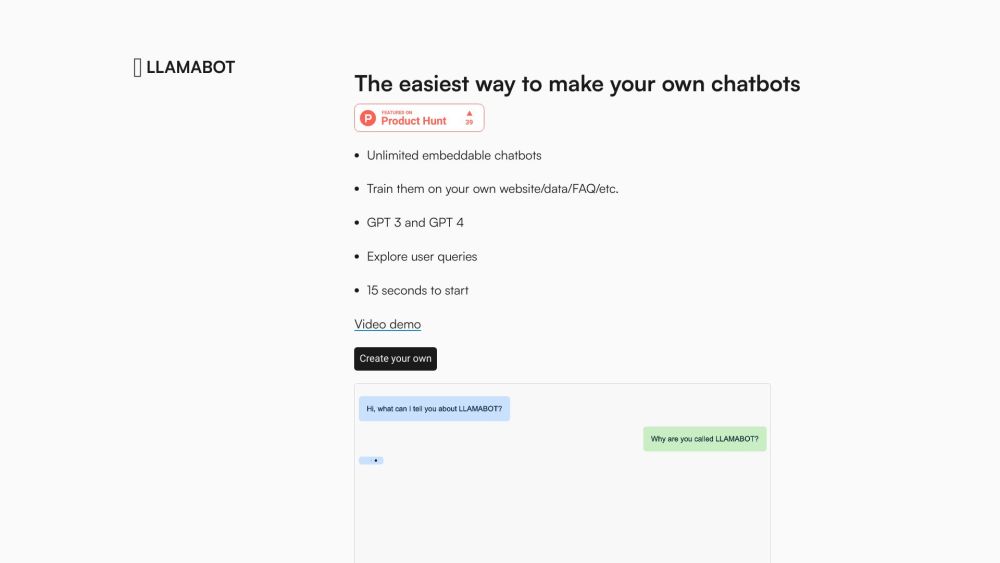
LLAMABOT
LLAMABOT: Design personalized chatbots, train using your own data, and integrate on your website. Offers unlimited bots with a user-friendly interface.
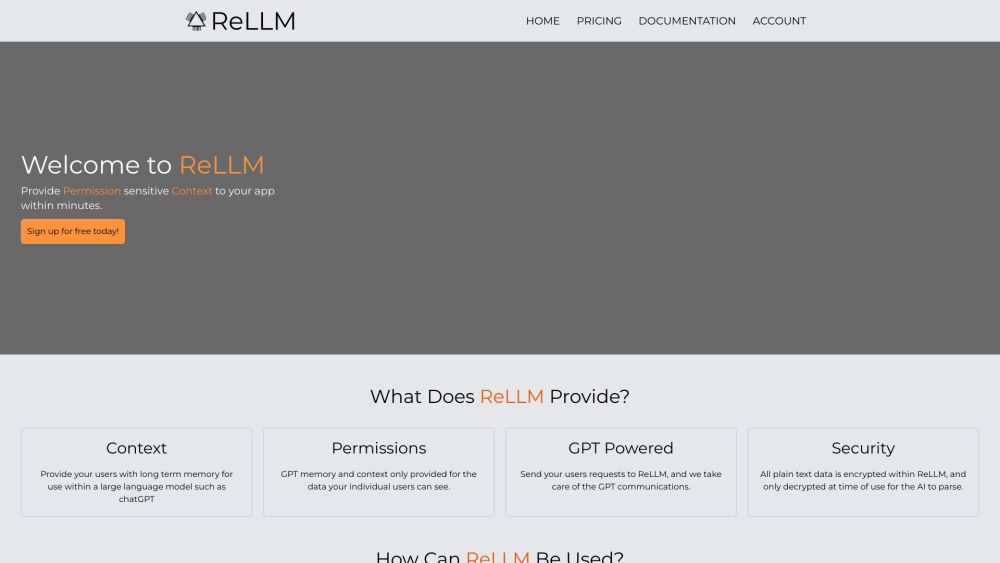
ReLLM
A platform providing your app with sensitive contextual information in just minutes.