TN
ToolsNetwork
ChartAI

ChartAI

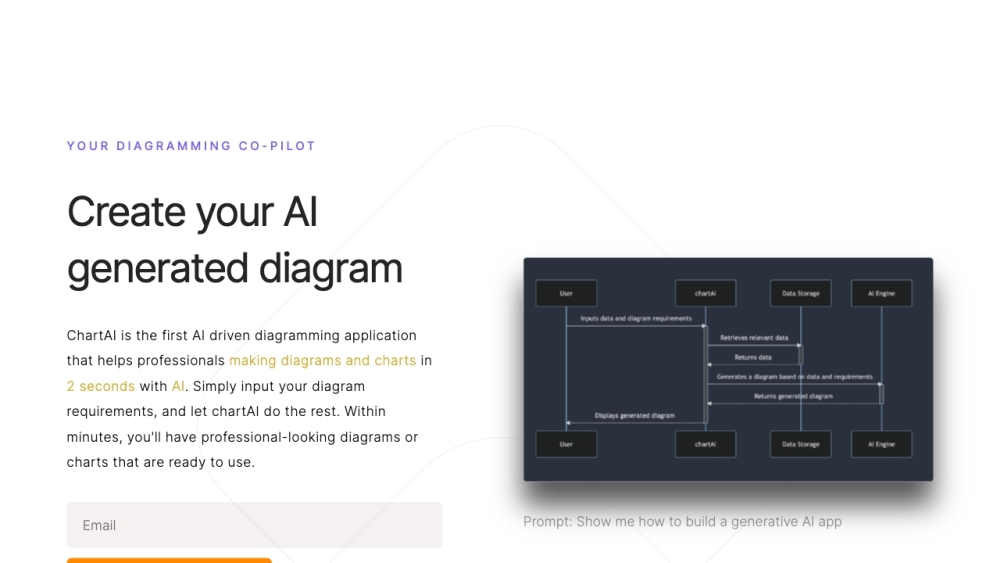
ChartAI utilizes ChatGPT technology to assist users in generating and interpreting charts and diagrams.

Social media links

What is ChartAI?

ChartAI is a website using ChatGPT technology to help users make and understand charts and diagrams.

How to use ChartAI?

To utilize ChartAI, just go to the website and enter the data or information you wish to visualize. You can then ask ChatGPT specific questions or provide instructions on how to design certain types of charts or diagrams.

Features

  • Key features of ChartAI include creating different kinds of charts and diagrams, giving insights and explanations about the data shown, and providing interactive tools to customize and manipulate visualizations.

Use Cases

  • ChartAI is useful in different situations like business meetings, school projects, data studies, and learning activities to make information or data look interesting and easy to understand.

Frequently Asked Questions

ChartAI is a helpful website that uses ChatGPT technology to aid users in making and understanding charts and diagrams.

To utilize ChartAI, just go to the website and enter the data or information you wish to visualize. Then, you can ask ChatGPT for specific guidance or instructions on creating particular types of charts or diagrams.

ChartAI is capable of creating various types of visual representations, such as vertical bar charts, line graphs, circular pie charts, scatter plots, flowcharts, Venn diagrams, and several others.

ChartAI is capable of examining the input data, then offering explanations, insights, and trends that relate to the visualized information.

ChartAI offers interactive tools and options that allow you to personalize and adjust the visualizations to suit your needs.

ChartAI is indeed ideal for educational use, enabling students and educators to create visually appealing representations of data or concepts effectively.
Alternative Tools